
Liquid Cooling Components and the PUE Boundary They Cross
A coolant distribution unit rated at 453 kW draws 4.5 kW at full flow. The server fans it displaces can take a tenth of server power in a dense machine. Both are metered, and they land on opposite sides of the boundary PUE draws: fan power counts as IT equipment energy, pump power counts as overhead. Each device between the chip and the outside air does one job, and which side of that boundary it sits on decides what the efficiency metric reports.
The cold plate captures three quarters of the rack’s heat at most
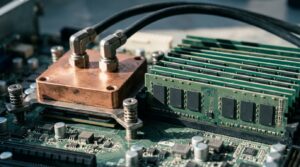
Cold plates do not take air out of the rack. A cold plate is a metal block with internal channels, clamped to a component, giving heat a conduction path into the coolant, with micro-channels on higher power versions extending the transfer surface. They usually sit on the CPUs and GPUs while the rest of the board stays on air. The Open Compute Project calls this hybrid basic cooling and states that CPU and GPU cold plates commonly capture 70 to 75 percent of IT equipment heat.
Source: Open Compute Project, “ACS Liquid Cooling Cold Plate Requirements Document,” Rev 1.0 (2019)
Terminology runs loose. DLC, direct-to-chip, D2C and cold plate cooling all name one arrangement. This piece uses cold plate cooling for the component, direct liquid cooling for the system, and immersion only where components sit in a dielectric fluid.
What the cold plate fixes is a ratio. Thermal resistance is the temperature difference between the processor case and the cooling medium divided by device power, in degrees Celsius per watt, and ASHRAE TC9.9 documents that the resistance required to cool a socket keeps falling as socket power climbs and case limits drop. In one TC9.9 case study of a dense half-width node, W27 water supports up to 500 W for each CPU and up to 12 W per DIMM with single-sided DIMM cooling.
Source: ASHRAE TC9.9, “Emergence and Expansion of Liquid Cooling in Mainstream Data Centers” (2021)
The cold plate is the only part of the chain with no moving parts and no power draw, which is why it gets treated as the whole technology. It is the least of it. A cold plate converts a chip temperature limit into a coolant temperature requirement, and every component downstream exists to meet that requirement. The quarter of rack heat left on air is also why a cold plate deployment does not retire the air handlers, which matters to anyone arriving here from why air cooling runs out at 20 to 30 kW per rack.
The manifold and the quick disconnects carry no thermal rating and still constrain the design
Nothing in the distribution hardware is specified in watts, and it sets limits anyway. The rack manifold moves coolant from the CDU to the IT equipment and back, and OCP requires it to deliver the needed flow rate at a targeted pressure drop, distributed uniformly inside the rack. Fluid velocity is capped between 1.5 and 2.1 m/s by pipe diameter, per ASHRAE, to limit erosion.
Source: Open Compute Project, “ACS Liquid Cooling Cold Plate Requirements Document,” Rev 1.0 (2019)
Quick disconnects are the serviceability layer. OCP specifies drip-less couplings that shut off flow at both ends on disconnection, in hand mate or blind mate form, with the Universal Quick Disconnect published as the interchange standard so suppliers’ couplings mate. Operating pressure in the technology cooling system loop typically runs 140 to 450 kPa with in-rack and row level CDUs.
Leak testing follows the higher of IEC 62368-1, at three times normal operating pressure, and ASME B31.3, at 1.5 times design pressure.
A manifold that distributes flow unevenly does not announce itself. It shows up as one node running hot while the CDU reports normal supply temperature and normal total flow, which is why OCP treats flow distribution as a design requirement, not a commissioning check. Pressure ratings, containment and intervention are site decisions needing engineering review.
A CDU is a boundary before it is a heat exchanger
The coolant distribution unit’s first job is separation. It gives the IT equipment an isolated loop, transfers heat across a liquid-to-liquid heat exchanger between that loop and the facility water system, and holds pressure, flow, temperature, dew point control, cleanliness and leak detection. OCP notes that splitting the loops also limits what a leak can do, because the TCS side holds less liquid at lower pressure and flow.
Source: Open Compute Project, “ACS Liquid Cooling Cold Plate Requirements Document,” Rev 1.0 (2019)
Capacity ratings are where the reading goes wrong. One published unit is rated at 453 kW nominal with an approach temperature difference of 4.0 °C and facility water at 32 °C.
The same box is also rated at 975 kW maximum with an approach temperature difference of 8.0 °C, 2.15 times the nominal figure, because approach temperature is the technology cooling system supply temperature minus the facility liquid supply temperature.
Maximum power consumption is listed as 4.5 kW at maximum flow and external pressure drop.
Source: Vertiv, “Coolant Distribution Unit (CDU) XDU450” datasheet, SL-07622 (2021)
What the rated flow implies about the loop
Governing equation: Q = ṁ × cp × ΔT
Assumptions, with units:
- Q = 453 kW, the nominal rating
- Secondary flow = 500 l/m, dual pumps running, taken as 8.33 kg/s at a density of 1.0 kg/L
- cp = 4.18 kJ/(kg·K)
Substituted: ΔT = 453 ÷ (8.33 × 4.18) = 13.0 K
Chained onto the rating condition, facility water at 32 °C plus 4.0 °C of approach gives 36 °C supply to the rack and 49 °C return.
The return sits inside the unit’s stated secondary range of 10 to 55 °C. That is an upper bound at the rated condition, not a measurement.
A CDU capacity figure without its approach temperature and facility water temperature is a number with no conditions attached. The loop temperature difference is what pumping cost turns on: halve it and flow doubles, while pressure drop through the same pipe climbs with the square of velocity.
Table 1. Temperatures along the heat path, chip to facility water°C
| Point in the path | Temperature | Source of the figure |
|---|---|---|
| CPU case limit, cold plate designs running on W32 water | 80–90 | ASHRAE TC9.9, 2021 |
| TCS return from the rack | 49 | Calculated at rated condition |
| TCS supply to the rack | 36 | Calculated at rated condition |
| Facility water supply, ASHRAE W32 ceiling | 32 | ASHRAE Thermal Guidelines, 5th ed |
| CDU secondary coolant range, lower end | 10 | Vertiv XDU450 datasheet |
| ASHRAE W class lower limit, all classes | 2 | ASHRAE TC9.9, 2021 |
* Case limit is a component ceiling, not a coolant temperature
* TCS figures calculated at one CDU’s nominal rating condition; not site measurements
Source: ASHRAE TC9.9, “Emergence and Expansion of Liquid Cooling in Mainstream Data Centers” (2021); Vertiv, XDU450 datasheet, SL-07622 (2021)
The facility water temperature decides whether the chiller runs, and it is heading down
Warm facility water is what removes mechanical cooling, and the classes describing it were rewritten around that. The fifth edition of ASHRAE’s thermal guidelines renamed the liquid classes W17, W27, W32, W40, W45 and W+, each numbered by its maximum supply temperature, all with a lower limit of 2 °C. W40 was added because manufacturers were designing for entering facility water near 40 °C, few of them able to hold above 45 °C.
Source: ASHRAE TC9.9, “Emergence and Expansion of Liquid Cooling in Mainstream Data Centers” (2021)
The payoff shows up at one documented site. SuperMUC-NG at the Leibniz Supercomputing Centre uses direct warm water cooling at 40 °C to 45 °C and drives adsorption chillers with the waste heat.
TC9.9 reports roughly 30 percent energy savings there and a cooling partial PUE under 0.07, attributed to servers without fans, warm water, and far less mechanical refrigeration.
The same committee expects supported water temperatures to regress. Cold plate products available at the time could often run on W45; TC9.9 projects that higher powered successors may only manage W32, and that requirements may eventually push facility water into W27. Its case study puts a 500 W CPU with 12 W DIMMs in exactly that position, removing the upper end of the economization window.
The efficiency case for liquid cooling is a claim about the facility loop, not about the cold plate. A rack on 27 °C water and a rack on 45 °C water look identical from the front and differ entirely in whether a chiller runs behind them. I read the W40 addition as the last comfortable stop before operators must choose openly between performance and cooling energy.
PUE counts the fans and not the pumps, so pulling the fans out can make the number worse
The boundary produces this result, not the hardware. ISO/IEC 30134-2:2016 defines power usage effectiveness as total data center energy consumption divided by IT equipment energy consumption over the same period, and puts cooling equipment such as chillers, cooling towers and pumps in the total. Its three measurement categories place the IT reading at the UPS output for PUE1, the PDU output for PUE2, and the IT equipment input for PUE3. Server fans sit inside the IT equipment at all three, and ASHRAE notes they run from the same UPS source as the server.
Source: ISO/IEC 30134-2:2016, clauses 5 and 6.2; ASHRAE TC9.9 (2021). A second edition, ISO/IEC 30134-2:2026, has since replaced the 2016 text.
The arithmetic
Governing equation: PUE = E(DC) ÷ E(IT)
Assumptions, with units:
- Compute hardware other than fans draws 900 kW in both cases
- Fans at 10 percent of server power on air and 2 percent after conversion, ASHRAE’s stated range for dense servers and its stated floor for optimized ones
- Facility non-IT energy held at 400 kW in both cases, isolating the metering effect
Air case: E(IT) = 900 ÷ 0.90 = 1,000 kW. E(DC) = 1,400 kW. PUE2 = 1.40.
Liquid case: E(IT) = 900 ÷ 0.98 = 918 kW. E(DC) = 1,318 kW. PUE2 = 1.44
Site energy falls 5.8 percent. The reported metric gets worse by 0.04. This is an illustrative calculation on stated assumptions, not a measurement. Holding facility energy constant is deliberate, since warm water cooling is what actually reduces it, and the 2 percent endpoint is optimistic for a hybrid rack where fans still run for the heat the cold plates miss.
The Uptime Institute Global Data Center Survey 2025 puts the weighted average annual PUE at 1.54 across 681 respondents, a sixth consecutive year of almost no movement.
Source: Uptime Institute, “Global Data Center Survey 2025” (July 2025)
ISO/IEC 30134-2 states plainly that PUE should not be used to compare different data centers. It is used for exactly that, constantly, in procurement. A business case built on a PUE target measures something the metric was never built to report. The quantity that matters is total facility energy per unit of compute, and PUE cannot see the denominator move.
Table 2. Which side of the PUE boundary each component sits on% of the power it handles
| Component | Loop | How PUE counts it | Power |
|---|---|---|---|
| Server fans, dense server on air | Inside the server | IT energy, both sides of the ratio | 10–20 |
| Cooling plant, warm water HPC site | FWS | Facility energy, numerator | <7 |
| Server fans, optimized server | Inside the server | IT energy, both sides of the ratio | 2 |
| CDU pumps, nominal rating | TCS / FWS boundary | Facility energy, numerator | 1.0 |
| CDU pumps, maximum rating | TCS / FWS boundary | Facility energy, numerator | 0.5 |
| Cold plate, manifold, quick disconnects | TCS | No power draw, neither side | 0 |
* Different bases: fan share is of server power, CDU share is of rated heat removal, plant share is of IT energy. Not directly comparable
* CDU shares computed from 4.5 kW maximum draw against 453 kW nominal and 975 kW maximum ratings
Source: ASHRAE TC9.9, “Emergence and Expansion of Liquid Cooling in Mainstream Data Centers” (2021); Vertiv, XDU450 datasheet, SL-07622 (2021); ISO/IEC 30134-2:2016
How far the CDU figures go
The CDU figures come from one manufacturer’s published datasheet and are rating conditions rather than measured site performance; rating conventions differ between manufacturers, and two capacity numbers are not comparable unless both approach temperatures and both facility water temperatures are stated. The 70 to 75 percent heat capture figure is OCP’s characterization of a common configuration, not a measurement of any specific server. ASHRAE’s projection that facility water classes will regress is a forecast from chip roadmaps visible to its member companies in 2021, and chip vendors typically have detail on one or two future generations only. The Uptime averages come from a self-reported survey of owners and operators conducted in the first half of 2025, weighted per respondent, so they describe the surveyed population and not the installed base. The PUE arithmetic in this piece is a worked example on stated assumptions and carries no site data.
Sizing the loop around approach, W class and residual air
Ask for a CDU capacity with its approach temperature and its facility water temperature attached, and treat any figure quoted without both as unspecified.
Compute the loop temperature difference from rated capacity and rated secondary flow before accepting a manifold and pipe sizing, because that number sets pumping cost for the life of the installation.
Establish which ASHRAE W class the incoming hardware actually requires, then check whether the site’s climate supports it without mechanical cooling for enough hours to justify the design.
Size the remaining air path for the share of rack heat the cold plates will not capture, and confirm that share with the server vendor rather than assuming full liquid capture.
Fix the PUE measurement category before comparing any two numbers, and state it as a subscript the way the standard requires.
If the project is justified on energy, write the business case in total kWh rather than in PUE, since converting from fans to pumps moves energy across the metric’s boundary in the direction that makes the ratio look worse.
References
ASHRAE Technical Committee 9.9, “Emergence and Expansion of Liquid Cooling in Mainstream Data Centers” / ASHRAE / 2021 / https://www.ashrae.org/file%20library/technical%20resources/bookstore/emergence-and-expansion-of-liquid-cooling-in-mainstream-data-centers_wp.pdf “ACS Liquid Cooling Cold Plate Requirements Document,” Rev 1.0 / Open Compute Project / October 9, 2019 / https://www.opencompute.org/documents/ocp-acs-liquid-cooling-cold-plate-requirements-pdf ISO/IEC 30134-2:2016, Information technology — Data centres — Key performance indicators — Part 2: Power usage effectiveness (PUE) / ISO/IEC / April 15, 2016 / https://www.iso.org/standard/63451.html “Vertiv Coolant Distribution Unit (CDU) XDU450,” datasheet SL-07622 (R06/21) / Vertiv / 2021 / https://www.vertiv.com/48ed4b/globalassets/shared/vertiv-xdu450-cdu_datasheet_en-na.pdf “Uptime Institute Global Data Center Survey 2025,” Keynote Report 180 / Uptime Institute / July 2025 / https://datacenter.uptimeinstitute.com/rs/711-RIA-145/images/2025.Annual.Survey.Report.pdf





댓글 0
첫 댓글을 남겨보세요.